Plot Example: AT68 (Limit State Function)
This page shows how to plot the limit state function over two stochastic variables and how to read the plots. Brinkpy has no separate plotting command, so the plots come from an analyze or simulate run with the --plot-lsf (-l) flag. This page covers only the plots. For the reliability results of an analyze run, see FORM Only.
How to Generate the Plots
Add an LSFplot block to the problem file (see LSFplot), then add --plot-lsf (-l) to an analyze or simulate command:
brinkpy analyze -l
brinkpy simulate -l
Brinkpy draws two plots of the same limit state function: one in the original variable space (x-space) and one in standard normal space (u-space).
analyze always runs FORM, so the plots also mark the failure point, also called the most probable point (MPP). With simulate, Brinkpy turns on FORM automatically when plot_failure_point is true in the profile (the default).
Run Context
Problem module:
problems/AT68Problem.py
Recorded result set:
results/2026-11-03/18-38-38/AT68-1bd88.xlsxresults/2026-11-03/18-38-38/AT68-1bd88.jsonresults/2026-11-03/18-38-38/AT68-1bd88.pyresults/2026-11-03/18-38-38/AT68-1bd88.pickleresults/2026-11-03/18-38-38/AT68-1bd88.pdfresults/2026-11-03/18-38-38/profile-1bd88.yaml
Profile and run mode from saved profile:
- Profile used:
default run_type: analyzeplot_lsf: true
For results-folder and filename conventions, see CLI Result Files.
Equivalent command:
brinkpy analyze -l
Problem File Used
Source: Ang, A. H-S. and Tang, W. H., Probability Concepts in Engineering Planning and Design, Vol. II, Wiley, 1990, p. 363, Problem 6.8.
AT68Problem.py defines three uncorrelated stochastic variables, Y and Z (lognormal) and M (Gumbel maximum). The limit state function is g = Y * Z - M, with resistance R = Y * Z and load L = M. See Probability Density Functions for the full definition.
The LSFplot block puts the resistance on the x axis and the load on the y axis:
"LSFplot": {
    "x_var": "Y",
    "x_lim": [30.0, 50.0],
    "x_func": lambda S, D: S[0] * S[1],
    "x_label": "Resistance: Y*Z",
    "y_var": "M",
    "y_lim": [800, 1800],
    "y_func": lambda S, D: S[2],
    "y_label": "Load: M",
},
Brinkpy varies x_var (Y) over x_lim and y_var (M) over y_lim, and holds every other stochastic variable (here Z) at its mean. x_func and y_func change only what the axes show: the x axis shows Y * Z instead of Y. Because z_var is omitted, the z axis shows the value of the limit state function, g(S,D).
How to Read the Plots
- Surface: the value of the limit state function over the plot window, colored by its value. The lines on the surface are contour lines of constant
g. - BP (base point): the point where every stochastic variable is at its mean.
- MPP (most probable point): the FORM failure point. It lies on the limit state surface, so Brinkpy draws it at
g = 0. - Axis limits: Brinkpy widens the axes when needed so that the base point and the MPP are visible, even when they fall outside
x_limandy_lim.
Generated Figures
The PDF result file for this run is saved as results/2026-11-03/18-38-38/AT68-1bd88.pdf. Because analyze always runs FORM, the file starts with the importance factors plot as Figure 1 (see FORM Only). The limit state function plots follow as Figures 2 and 3.
Figure 2: Limit State Function in x-space
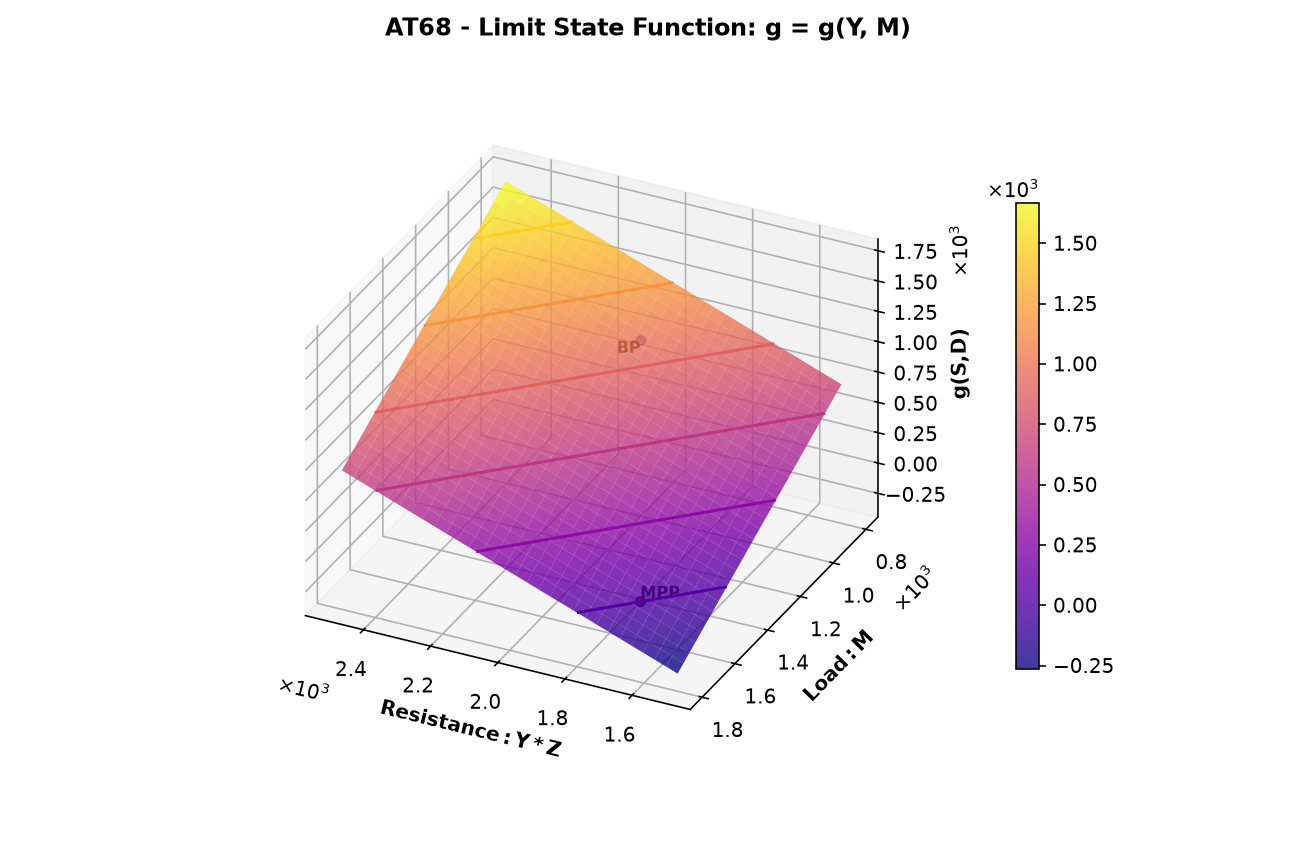
The x axis shows the resistance Y * Z from 1500 to 2500, that is, Y from 30 to 50 times Z = 50. The y axis shows the load M. Because g = Y * Z - M, the surface is a plane that rises with resistance and falls with load.
The base point is at Y * Z = 2000 and M = 1000, where g = 1000. Over this window, g runs from 1700 down to −300, so the surface crosses into the failure region g ≤ 0 in the corner with low resistance and high load. The contour lines are drawn every 300, so the darkest line, which passes near the MPP, is g = 0, the limit state surface.
The MPP is at Y * Z = 1673 and M = 1673, where resistance equals load. y_lim extends to 1800 so that the plot window includes the MPP and the failure region around it. When you choose x_lim and y_lim for your own problem, include the MPP, or the surface may not reach g = 0 at all.
The MPP is drawn at g = 0 but sits slightly below the surface. The surface holds Z at its mean of 50, while at the MPP Z = 48.78. With Z = 50, the surface at that point has g = 42.
Figure 3: Limit State Function in u-space
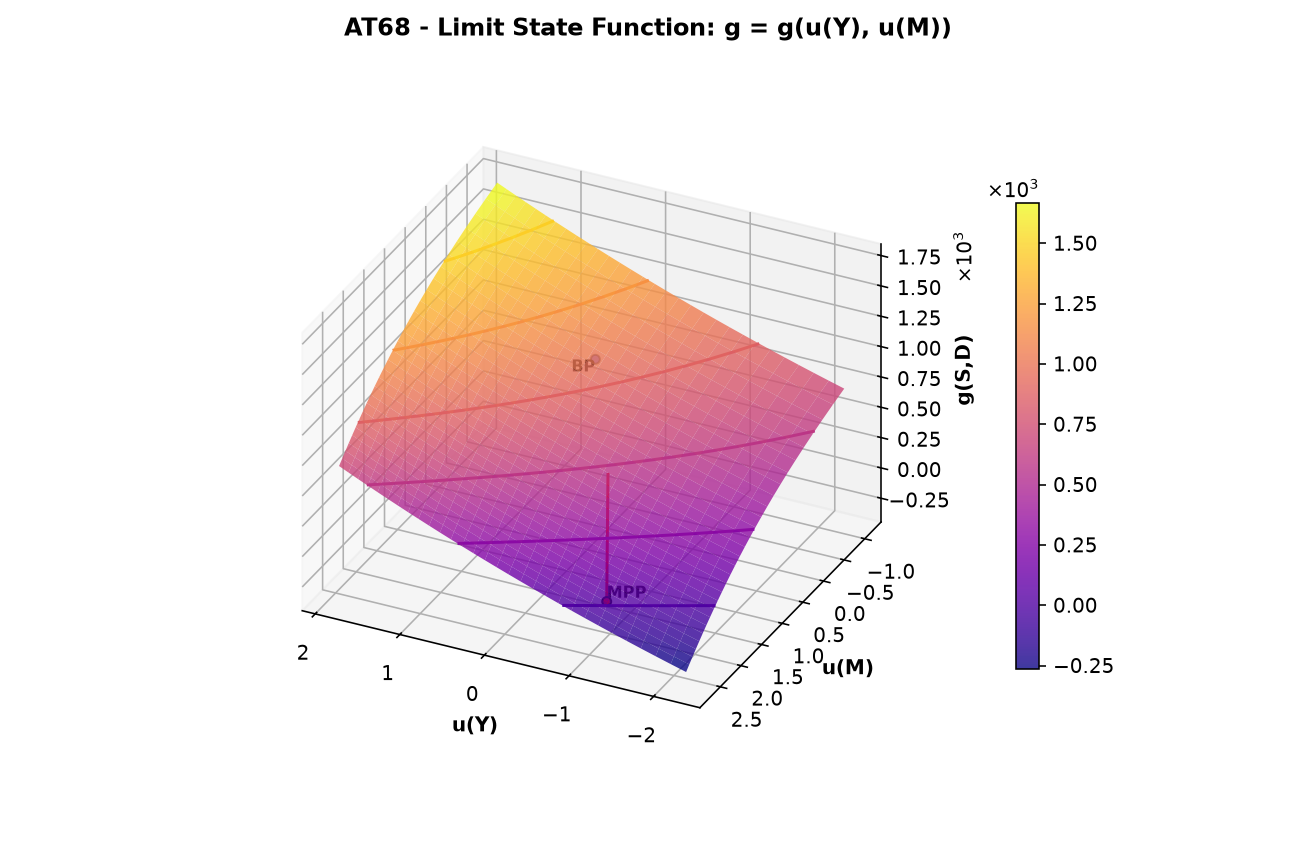
The same limit state function, plotted over the standard normal variables u(Y) and u(M). The u-space plot always uses x_var and y_var directly, so x_func and y_func do not apply. The window Y from 30 to 50 becomes u(Y) from −2.25 to 1.85.
- The transformation to u-space is nonlinear, so the contour lines curve, although the surface is a plane in x-space.
- The base point is not at the origin, at
u(Y) = 0.06andu(M) = 0.18. The origin of u-space corresponds to the median of each variable, and the mean of a lognormal or a Gumbel maximum variable is larger than its median. - The surface crosses
g = 0near the MPP, in the corner with lowu(Y)and highu(M). - The red line runs from the origin to the MPP at
u(Y) = −1.17andu(M) = 2.43. It is the part of the FORM reliability vector in theu(Y)andu(M)plane. Its length is 2.70, a little shorter thanβ = 2.742because the MPP also hasu(Z) = −0.47.
Profile Options
The lsf_plot_options section of the profile controls how the plots are drawn. This run uses the defaults:
lsf_plot_options:
  n_x_points: 30
  n_y_points: 29
  plot_base_point: true
  plot_failure_point: true
  with_labels: true
  ignore_axis_funcs: false
  view: auto
  cmap: plasma
  type: surface
| Option | What to change it for |
|---|---|
n_x_points, n_y_points |
A finer or coarser grid. More points give a smoother surface but take more limit state function evaluations. |
plot_base_point |
Hide the base point with false. |
plot_failure_point |
Hide the MPP and the red line with false. With simulate, this also stops Brinkpy from turning on FORM. |
with_labels |
Hide the BP and MPP labels with false. |
ignore_axis_funcs |
Plot x_var and y_var directly with true, ignoring x_func and y_func. In this example the x axis would show Y instead of Y * Z. |
view |
The viewing angle of the 3D plot. auto (the default) chooses the elevation and azimuth that best show the details of the figure. default uses the Matplotlib default view. XY, XZ, and YZ look straight at that plane, and the versions with a minus sign (for example -XY) look at it from the opposite side. A tuple sets the elevation, azimuth, and roll in degrees, for example (30, 120, 0). |
cmap |
The colormap of the surface, as a Matplotlib colormap name. |
type |
contour to draw only the contour lines of g, still in a 3D plot, instead of the shaded surface. |
To change these options, create a custom profile and run it by name, for example brinkpy analyze myprofile -l. See Profiles and LSF Plot Options for the allowed values.